This article follows the Philippine Statistics Authority (PSA) report on 2021 death statistics. The said agency released a new update on 2021 death statistics preliminary as of February 28, 20221https://psa.gov.ph/vital-statistics/table.
2021 Excess Death
This year, in January, we published a preliminary PSA report covering January to September only of 2021 [see 2021 Excess Deaths in the Philippines Shows Pandemic, but it is Not COVID]. We discussed the excess death of 45.5% against the 10-year average of the same period.
However, the most recent report has recorded 290,125 all-cause mortality excess deaths, a whooping 51.54% growth compared to the 10-year average2https://psa.gov.ph/content/registered-deaths-philippines-2019; https://psa.gov.ph/sites/default/files/attachments/crd/specialrelease/SR%202018%20Deaths_0.pdf; https://psa.gov.ph/sites/default/files/attachments/crd/specialrelease/2017%20Special%20Release%20on%20Death.pdf; https://psa.gov.ph/sites/default/files/attachments/crd/specialrelease/2016%20Death%20Statistical%20Tables.pdf; https://psa.gov.ph/sites/default/files/attachments/crd/specialrelease/Final_%20SR%202015%20Deaths.pdf; https://psa.gov.ph/content/death-philippines-2014; https://psa.gov.ph/sites/default/files/attachments/crd/specialrelease/2013%20Tables_0.pdf; https://psa.gov.ph/sites/default/files/Table%202_2.pdf; https://psa.gov.ph/sites/default/files/Table%202_1.pdf. This already includes the preliminary data from January to December. See image 1 below.
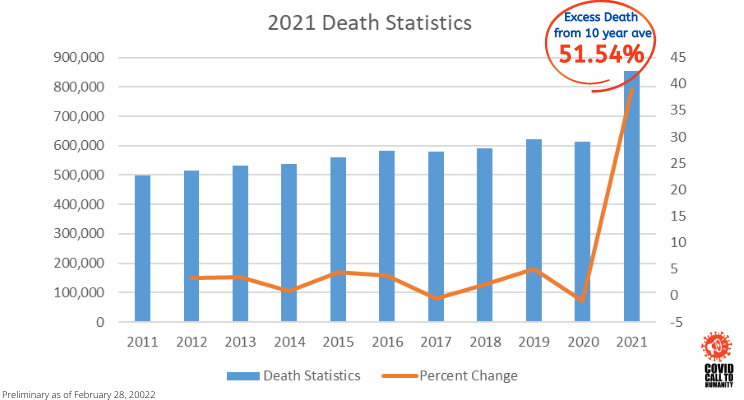
World Health Organization declared a pandemic in 2020, and all the governments had scurried to lockdown and other Draconian measures that, after two years, were determined to be detrimental rather than beneficial [see One Year On, Evidence Shows the Great Barrington Declaration Was Right; Top infectious disease expert in UK reveals anomalous practices in deciding country’s pandemic response; New study: Stringency of measures to fight pandemic, lockdowns, no effect on death rate; It’s time to rethink COVID restrictions; The Philippines’ COVID-19 Response Left the Vulnerable Behind]. In the Philippines, 2020 recorded a decrease roughly by 7,000 death counts. Showing that COVID-19 had no toll on Filipinos during the height of the touted pandemic [see Despite COVID-19, Philippines registers 3% lower deaths in 2020].
What could be the driving force behind all these excess deaths? Should the government be alarmed? Are there ongoing investigations on this report? When we thought 2021 would be better off because we have the covid jab to save us from severity and fatality of covid, why is there an increase in total mortality? Again, just like what we have asked before, if it is not covid, what is it then?
Let’s look at all the regions to see what contributes the most. Image 2 shows the death statistics for 2020 and 2021 in all areas.
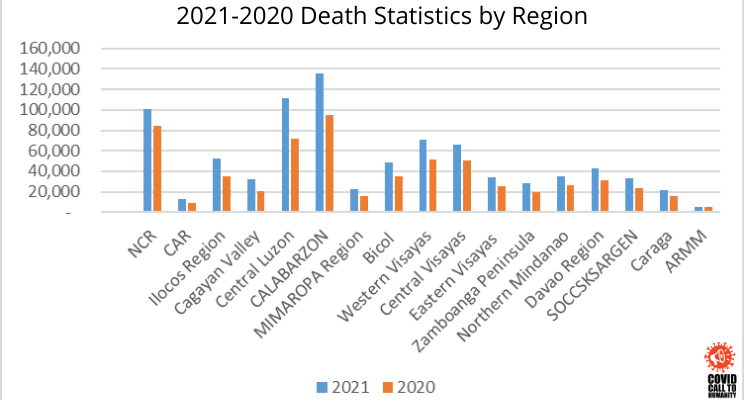
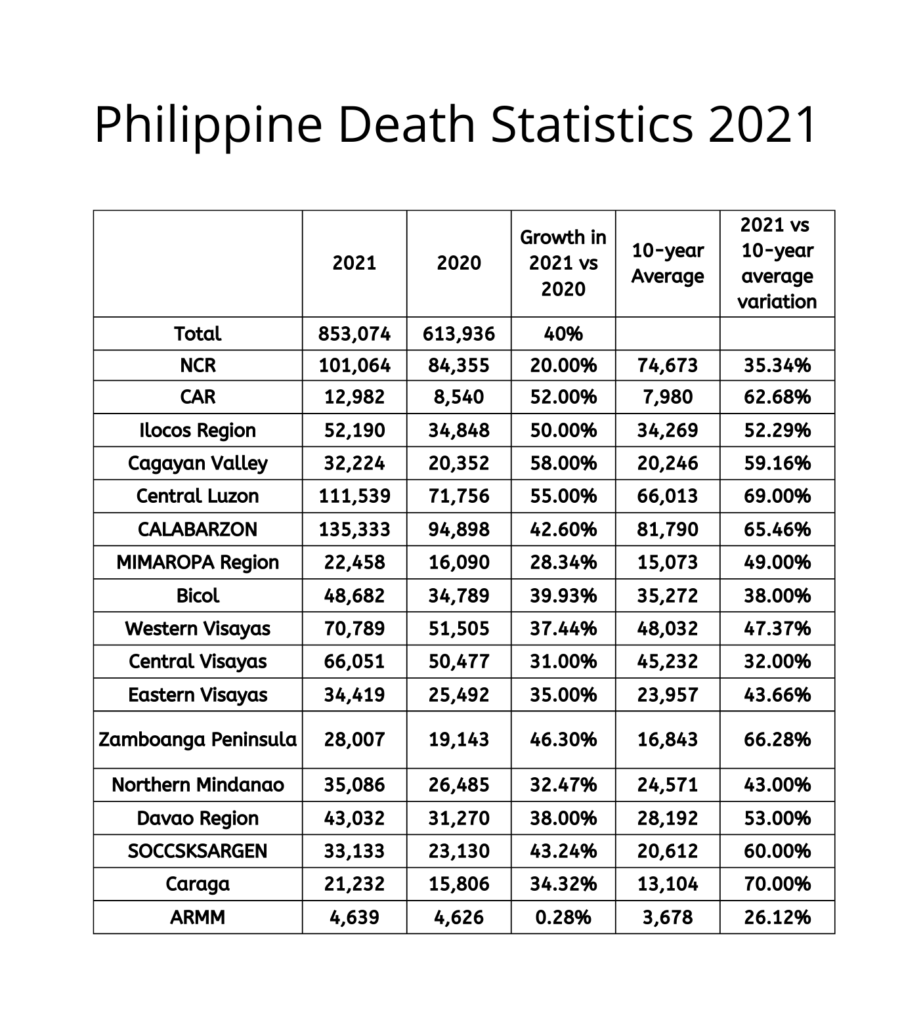
Also, the following are the top 5 of the 17 regions:
| Region | Excess Deaths 2021 vs. 2020 | Excess Deaths 2021 vs. a 10-year average |
| CALABARZON | 42.60% | 65.46% |
| Central Luzon | 55% | 69% |
| National Capital Region | 20% | 35.34% |
| Western Visayas | 37.44% | 47.37% |
| Central Visayas | 31% | 32% |
See also image 4 below, 2020 and 2021 death statistics compared to 10-year average death figures.
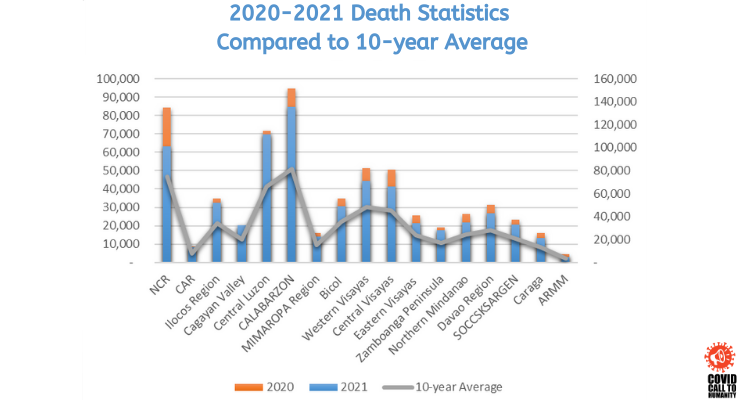
When we thought covid jabs decreased mortality, what could be taking place now since this report comprised all causes? Do we have war, famine, or genocide? When the percentage change annually starts from almost 1% to 5%, what you see now speaks of extreme anomaly and needs to be the priority for investigation. [Refer to image 1 above]
This excess death is not something we shove to the back burner; this is something alarming. Another investigation early this year cited a depopulation point3https://supersally.substack.com/p/democide-in-the-philippines?r=l1r7e&s=r using PSA data. There will be a significant change in that report with the updated data, but that will be a whole new editorial.
Going back to image 2, CALABARZON ranked the highest and the Bangsamoro ARMM region the least. What does this tell us? Does the population rate have something to do with the numbers? It is a factor, but not this time.
All Causes Mortality
Looking at the 2021 causes of death, the published data is only updated as of January 2022, and there was a slight discrepancy in total death counts versus the February 28 release. Nonetheless, covid is not the topmost causality, but it ranked third with the item COVID-19 Virus Identified. Ischaemic heart disease maintained the number one spot with a 29.72% increase from 2020. Followed by cerebrovascular with 15.35% growth from last year4 https://bit.ly/3KjEAbrPSACauseofdeathprelimJan312022].
Using this available data for cause of death, the top 10 are shown in image 6 below.
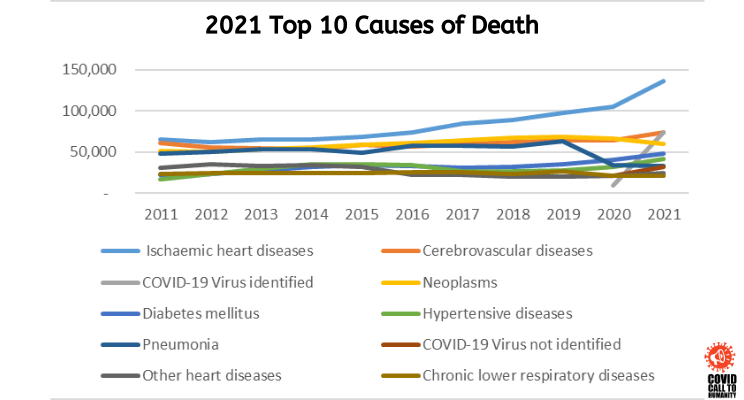
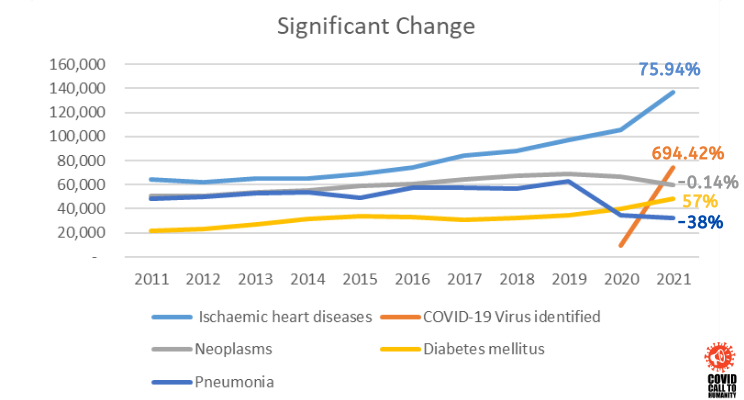
Ischaemic heart diseases have immensely increased, with a variation of 75.94% compared to a 10-year average of 2011 to 2020. COVID-19 Virus Identified had leapt to the third spot overtaking neoplasm, with a growth of 694.42% from 2020—[We will talk more about covid mortality later].
What is startling with this data is that three causes of death have maintained their spots for the past ten years and have increased percent change, neoplasm, diabetes mellitus, and pneumonia. Neoplasm in 2021, compared to the 10-year average, had a 0.14% decline. If we look at the data a decade before 2020, Neoplasm had an average of 57,938 deaths per annum. In 2020, neoplasm registered 66,342 and plummeted to 59,503 in 2021 or -10.31% from 2020. This is a good sign. Individuals with cancer are decreasing despite the pandemic and all the restrictions. We hope it declined and is not just a mere misdiagnosis.
Furthermore, pneumonia has averaged over 53,000 cases for the past ten years, declined to -35.87% in 2020, and plunged more to -38% in 2021. Does this mean the Philippines have already found a cure for pneumonia? Or, perhaps a misdiagnosed covid? See image 7 for the significant changes below.
COVID-19 Fatality
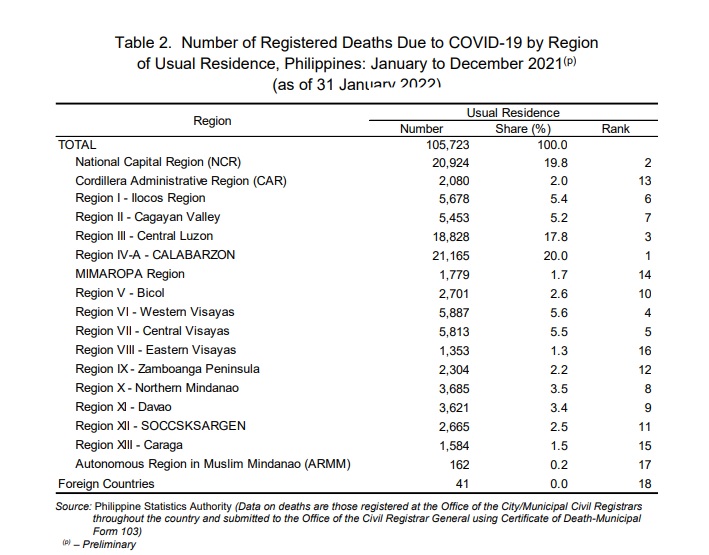
Going back to the COVID-19 virus identified, we previously discussed that PSA follows the WHO category on death reporting. Virus identified means that an RT-PCR test confirmed COVID. The other is the COVID-19 “virus not identified,” so COVID was only assumed as the RT-PCR test returned negative or no test was conducted. Let’s dissect the latest PSA data with recorded covid-19 deaths of 105,723 [There’s a slight disparity in PSA data, but we’ll take this figure.] COVID death here refers to both identified and not identified.
What region has the highest death because of covid? The top 3 are CALABARZON, Central Luzon, and National Capital Region, and the three least are Caraga, Eastern Visayas, and ARMM. ARMM had only recorded 162 deaths. See image 8 below.
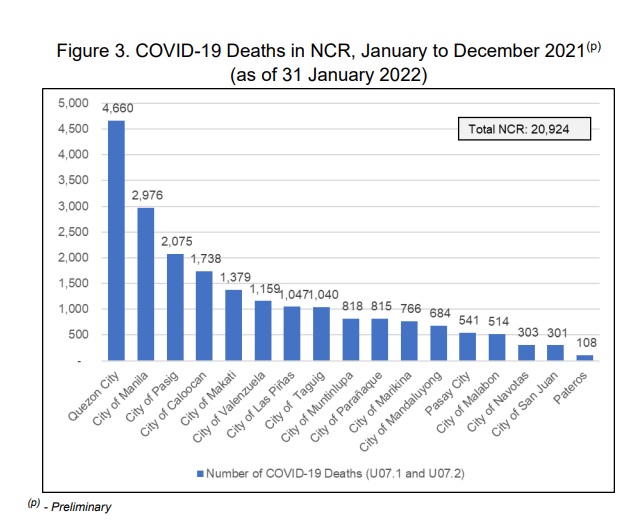
Also, Quezon City topped the list in NCR with the highest covid deaths Pateros as the last. See image 9.
With this 2021 data, has the covid jab reduced the mortality? Global data say the more you vaccinate, the higher the cases, hospitalization, and deaths [see Worldwide data from 185 nations prove that the highest death rates are in the most vaccinated countries; we are now in a pandemic of the vaccinated; Big Data Analysis of 145 Countries Shows Vaccine Deployment Led to Increase in COVID Deaths and Cases]. Is the Philippines heading in the same situation as other countries? Note that the Philippines only started inoculation on March 1, illustrating a delay of three months from other countries. Therefore, can we say what’s happening in other nations could occur in our country, too?
May we point out that other countries’ adverse events reporting systems are more advanced than our pharmacovigilance locally. Looking through other countries’ data, we see that these jabs have already caused severity and mortality. Could this be the same case here? Can we assume the 290,000 excess deaths be due to covid jabs? Certainly not. There are co-morbidities and purported pandemic to blame [see DOH: Death of health worker due to COVID-19, not vaccine; CDC Director Says Study of Vaccinated People Show 75% of COVID-19 Fatality Had Four or More Comorbidities].
Health authorities might say we have unfounded suppositions. They can say that because they are the gatekeepers of the data, for now. Worldwide scientific data demonstrate a blinding truth, what Philippines can do is to allow autopsies, determine real vaccination status of the patients and audit all death certificates with covid as the ONLY cause of death. [See End vaccine misinformation: Mandate autopsies for anyone who dies within two months of vaccination; Autopsies show irrefutable evidence of deaths due to COVID vaccine; Experts Find Inflammation, Organ Damages on Autopsies of Vaccinated Individuals; Confirms Vaccines Contain Toxic Chemicals; Ground-breaking autopsy report shows the vaccinated had toxic spike proteins all over the body; “Vaccines” are Premeditated Murder. MSM Snubs Massive Proof ]. Most often than not, there are massive anomalies, numbers do not lie. As much as authorities desired to sweep the facts under the rug, truth is coming out [see The truth about COVID deaths is a coming out; Vaccine Death Report: A Compilation of Vaccine Adverse Events and COVID truths Ignored By Governments and Mainstream Media, Censored by Social Media].
Resources
- 1
- 2https://psa.gov.ph/content/registered-deaths-philippines-2019; https://psa.gov.ph/sites/default/files/attachments/crd/specialrelease/SR%202018%20Deaths_0.pdf; https://psa.gov.ph/sites/default/files/attachments/crd/specialrelease/2017%20Special%20Release%20on%20Death.pdf; https://psa.gov.ph/sites/default/files/attachments/crd/specialrelease/2016%20Death%20Statistical%20Tables.pdf; https://psa.gov.ph/sites/default/files/attachments/crd/specialrelease/Final_%20SR%202015%20Deaths.pdf; https://psa.gov.ph/content/death-philippines-2014; https://psa.gov.ph/sites/default/files/attachments/crd/specialrelease/2013%20Tables_0.pdf; https://psa.gov.ph/sites/default/files/Table%202_2.pdf; https://psa.gov.ph/sites/default/files/Table%202_1.pdf
- 3
- 4
